

You may find this map familiar if you have been watching financial videos on YouTube. This is a map of the S&P 500 companies’ performance (changes in share price) breakdown by sectors such as Tech, financial, energy, real estate, utilities, etc.

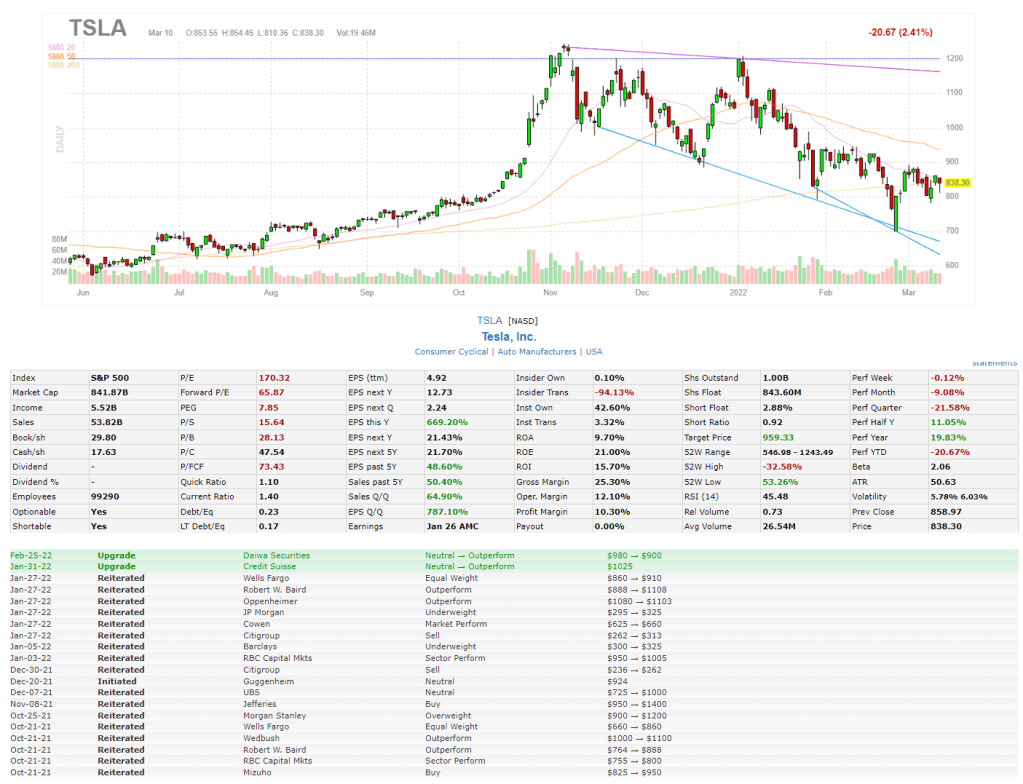
You can select different time frame to check the price change in the past 1 week, 1 month, up to 1 year. You can also check some useful metrics of the various companies such P/E, forward P/E. P/S, P/B, dividend yield or analysts recommendation.

There are other tabs on this website that provides you with useful info such as news, stock screener, realtive performance by groups.
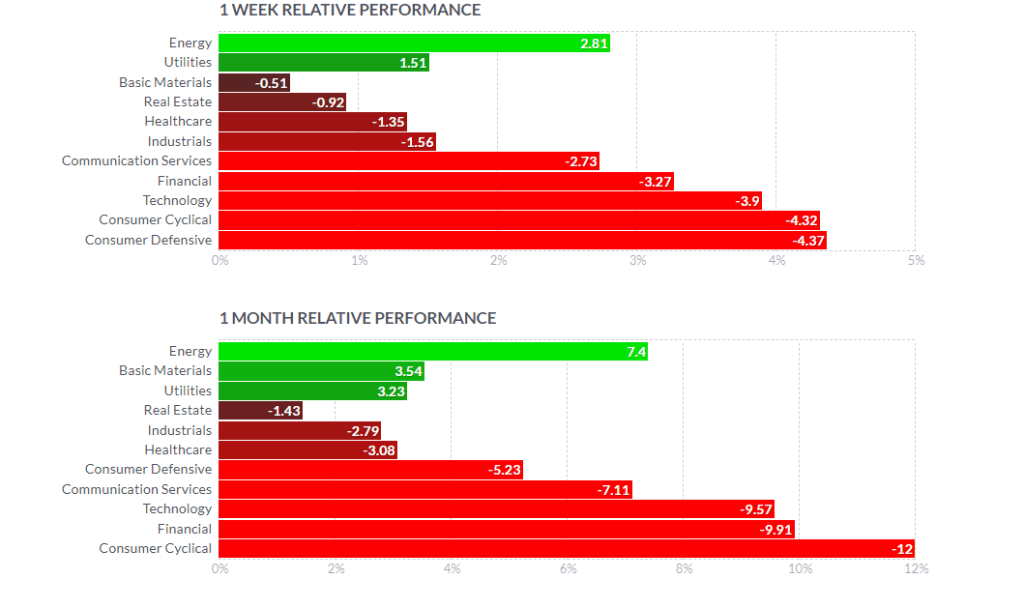
Such information are useful for investors/ traders to know not just how each stock is performing but also how the sectors are performing compared to other sectors in the stock market.
By knowing which sectors are performing well, you can plan your strategy to either diversify your portfolio or look for buying opportunities in those sectors that have not been doing very well.
You can also check out the target price of a particular stock given by the various investment banks on Wall Street, to give you a good sensing and reference on how the instituitional investors are rating the respective stocks.
All the above information are available for free via this website:
https://finviz.com/map.ashx?t=sec
<< Subscribe to my blog to have all these articles delivered directly to your email address >>
*** SEE MY TRADES & PORTFOLIO ON PATREON ***
If you are interested to find out more about my options trades and investment portfolio, I will be updating them on Patreon (on the same day I made the trades), so do follow me there if you need some reference or inspiration.
*** EARN FREE MONEY ***
Sign up for WeBull Securities Brokerage and sure-win free shares:
Receive Free Money When You Sign Up With WeBull Securities Platform
*** FREE BEGINNER GUIDE TO OPTIONS TRADING ***
Keen to learn about options trading but do not wish to pay for expensive courses, this newbie guide will help gain the knowledge and fundamentals to understand options better. And it’s totally free!
The Newbie’s Guide To Options Trading
*** FREE MOTIVATIONAL BOOK ***
If earning more money from your investment does not excite you anymore, you may be seeking a purpose that brings fulfillment and meaning in life. I have written a motivational book that may be useful to you in some ways. You can also download a free copy here:
https://learninginvestmentwithjasoncai.com/finding-the-magical-realm-of-happiness-motivational-book
*** FOLLOW US ON SOCIAL MEDIA ***
Follow me on Facebook, LinkedIn, to get notified of my latest posts on social media. Or subscribe to my blog (scroll to the bottom of the page) to have my new posts sent directly to your mailbox.
*** BUY ME A CUP OF COFFEE ***
If my blog has benefited you in some ways and you would like to offer a token of appreciation, you may do so via this page. Thank you very much for your support!
*** MUST-READ BLOG POSTS ***
After accumulating more than 600k of unrealized losses on my portfolio, I wrote this article to encourage friends and investors who are also losing a lot of money to the market.
If You Are Feeling Depressed From Losing Lots Of Money In The Stock Market, Here’s An Article For You
In the 10 years of my investing journey, I have made many mistakes but also learned many lessons from these mistakes. I compiled the 10 most valuable lessons that I have learned and may they help you succeed in your investing journey.
Happy 10 Years Of Investing | 348k (Realised) Profit, 635k (Unrealized) Loss & 10 Lessons Learnt
The precious 6 lessons I learnt after cutting more than half a million of losses in the stock market through bad investments and risky trades.
6 Lessons Learnt After Losing 551k In 10 Years Of Investing & Options Trading | What Newbies Should Know They Start Investing/ Trading
How I managed to build a 1M investment/ trading portfolio despite coming from humble beginnings.
How A Poor Kid Got To A 1M Investment Portfolio | Tips & Principles Of Building Wealth
I did these 10 side hustles while holding a full-time job, so I share them here so you can be inspired to grow your wealth through a side hustle that you enjoy.
I Did These 10 Side Hustles While Working Full Time | 10 Side Hustle Ideas To Help You Earn An Extra Income
Struggling with inflation and high cost of living? Try these 10 methods to help you save money and accumulate more savings for investments or rainy days.
10 Ways To Save Money To Help You Fight Inflation & Rising Costs Of Living
Why I am building $120,000 of cash reserves in Singapore Savings Bonds (SSB) & 5 reasons why I think SSB is a worthy low or zero-risk investment that you can consider.
Why I Am Building $120,000 Of Cash Reserves In Singapore Savings Bonds (SSB)? | 5 Reasons Why SSB Is A Worthy Low-Risk Investment
Sharing why I am doing Dollar Cost Average (DCA) into SPY and QQQ ETF for long-term investments and a step-by-step guide to doing it automatically with Interactive Brokers.
Why I Am Doing DCA (Automatically) For SPY & QQQ For My Long Term Investment? (20% ~ 30% Upside Potential) | Step By Step Guide To Activating Automatic Recurring Investment On IBKR
Can options trading provide you with extra sideline income every month? In this post, I share my experience of generating income from options trading over the last 3 years.
Options Trading For Passive Income: Truth Or Myth?

Thanks. Jason. Appreciate the info. Cheers.
LikeLike
Happy to share, Bro 🙂
LikeLike